The American Energy Transition in 15 Maps
As the world continues to suffer a major energy crisis with high energy prices, broader inflationary pressures, and little prospect of relief, it is increasingly apparent that we may be crossing a major inflection point in energy markets. Major changes to the macroeconomic conditions, as well as the intersection between growing clean energy market share and limited long-term investment in fossil fuels, may mean that prices are likely to stay higher for longer. Following a decade of low oil and natural gas prices, price volatility and threats of unavailability for the most vulnerable consumers are back in force.
Recognizing this inflection point, now is an excellent time to take stock of the shape, structure, and direction of U.S. energy markets. Thanks to elevated shale production and a renewed focus on domestic supply chains, the U.S. will remain a dominant force in global energy geopolitics.
Given the complexities of energy markets and their associated geographies, maps can be very useful tools to convey large amounts of information quickly. This post provides 15 of my favorite maps that provide a snapshot of the current status of the American energy transitions.
1. Extent of RPS, Decarbonization, and Clean Energy Standards

Source: Clean Air Task Force
States and utilities are central actors in clean energy and climate policy in the U.S., a role that they continue to embrace. This map shows the growing extent of 100% decarbonization, clean energy, or renewable energy commitments in the power sector by states and utilities. Renewable portfolio standards have been very effective demand-pull policies to jumpstart the sector and the spread of similar policies are encouraging.
There are three interrelated trends this map captures:
A growing number of states are enacting 100% decarbonization or clean energy standards. Most of these target 2050.
Although renewable portfolio standards were integral in early expansion of renewable energy, states are generally electing for a technology-neutral clean energy standard over a 100% renewable standard.
Utilities are increasingly stepping up with clean energy commitments of their own, particularly in regions where state policy mandates are not in place.
The map is interactive, and updated continually, so it is worth clicking through to get a sense of where at least high level strategies and plans are heading. For similar maps with more narrative, see this piece from NRDC. With this emerging state policy framework and utility commitments, the power sector appears increasingly on track to decarbonize by 2050.
2. Collapse in Coal Power

Source: Brookings
A central part of cleaning up the U.S. electricity grid is the rapid decline of coal power. After producing more than 50% of U.S. electricity in the mid-2000s, coal recently fell as low as 20%. In that timeframe, almost 1/3 of coal capacity has retired with most of the smallest and least economic units closing first. This is a (somewhat) older map but it shows the increasing wave of coal plant retirements, particularly concentrated on the East Coast and near the Marcellus shale (for similar interactive maps see UCS or Sierra Club).
There are major factors driving this decline:
The shale revolution, the emergence of cheap gas prices, electric regulatory restructuring, and a rapid natural gas combined cycle build out between 2000-2002 created the conditions for a rapid shift from coal to gas
A lack of new coal builds means that most retiring plants are 50-70 years old, meaning they are relatively inefficient, have high fuel and O&M costs, and often have large amounts of their capital costs already paid off (this is less important with the rise of wholesale markets)
A concerted effort by environmental groups to use environmental law at the national level, Public Utility Commission intervention at the state level, and direct targeting of specific facilities (a la Sierra Club’s Beyond Coal campaign).
Of these, the last factor is hardest to quantify. Despite clear directives in the Clean Air Act amendments of 1990, regulation of mercury emissions has been stuck in executive agency deliberations and judicial purgatory. The 2015 imposition of MATS, now since rescinded, tipped many plants into retirement. In many case, utility and PUC decisions influenced by environmental groups were primarily driven by costs, creating useful alliances between ratepayers, environmentalists, the natural gas industry, and other stakeholders.
Coal is in a death spiral in the U.S. At least 28% of remaining coal plants currently plan to retire by 2035. Carbon capture appears too costly for coal generation (in part because utilities resisted R&D investment), other environmental requirements are too stringent, and the thermal efficiency of the fleet is a persistent challenge. Most poignantly, the industry is now functionally unable to invest in itself, despite the boom of high prices in recent months. Financing any mine can be a challenge but financing a coal mine when the industry is on the verge of death and interest rates are rising is especially difficult. This means that, even as coal demand falls, supply will fall in tandem, limiting price declines and other cost innovations that could keep the sector competitive. Hence, death spiral.
Coal appears on track for less than 10% of generation by 2030 and could actually break below 5% or even 1% in aggressive clean energy growth scenarios. For a bonus interactive map of these retirement plans see this EPA tool.
3. State level energy production is increasingly renewable, 2020 data

Source: Visual Capitalist
The growth of renewable energy is nigh unstoppable, with wind and solar taking a leading role in capacity additions across the country, often competing with natural gas. Together, wind, solar, and hydro now provide as much electricity as nuclear power, leading to ~40% of total U.S. power generation coming from carbon-free sources.
It is hard to both emphasize how quickly renewable energy has grown and how woefully insufficient continued growth expectations are compared to the extent of the climate imperative. Even though I somewhat dislike this map because it is so busy, I think this map does a good job at both. Many states now have significant renewable energy production, whether hydro (Northwest), wind (Midwest and plains), and solar (Southwest). Nevertheless, coal remains stubbornly high and natural gas is now king for many states, including renewable leaders like California.
This map is not ideal for comparing total amounts across states (Texas produces 200 times Vermont but is the same size) but is really useful if you are looking for your specific state. It also has all the numbers available in total terawatt-hours and percentage shares.
Many states and regions that enacted aggressive RPSs or CESs are emerging as clear leaders in renewable energy production. After many years of high expectations, solar is finally rip-roaring across Texas, which is now poised to take the mantle of largest solar producer from California. Renewables are driven by a powerful combination of factors:
Falling technology costs, buoyed by globally competitive and growing supply chains is reducing input costs across the board.
Financial and business model innovation, coupled with the spread of wholesale electricity markets and cost-conscious utilities is leading to the financialization of renewable energy production.
Timely and robust policy support from federal, state, and other governments acting to both demand-pull via mandates and supply-push with tax credits.
However, many of these factors may be shifting given the broader macroeconomic challenges. Given their capital-intensive nature, rising interest rates, high commodity prices, and periodic trade wars mean renewable energy could face major potential headwinds. After many years of price declines, recent contracts demonstrate rising prices. Supply chain issues for solar, particularly concerns about Uyghur labor in China and recently delayed tariffs on panel imports, are also likely to remain persistent challenges.
Further, whether justifiably or not (and largely not), emergent concerns about energy reliability resulting from renewable energy growth is leading to political pushback on further growth. Variability may well pose a reliability threat but the largest impact in the near-term at current penetration levels is economic due to balancing and even then it is relatively limited in practice.
4. Reliability map underscores emergent risks

Source: NERC
After several decades of relatively high electric reliability, due to excess transmission and generation capacity from the pre-restructuring era, the U.S. is beginning to face increasing reliability disruptions and concerns. NERC, the quasi-governmental entity responsible for North American energy reliability, has indicated in its major annual summer report that at least seven regions face reliability threats this summer:
MISO, the second largest power market in the country, faces a high risk of insufficient reserves
The entire Western interconnect plus ERCOT and SPP face elevated risks
This is a rather stunning assessment, following on the 2021 assessment which found similar shortfalls across the country. Previous assessments usually only identified ERCOT as a region of concern (due to insufficient capacity procured by its market design).
Usually, outages are primarily caused by transmission and distribution disruptions. Maintaining reliability is a top concern for regional markets, making persistent generation shortfalls a big sign of concern. Coal and some nuclear plants are retiring more quickly than expected, natural gas is mainly increasing its capacity factor (not its net capacity), and renewables are growing but are not providing firm capacity.
More broadly, NERC’s 2021 long-term assessment identified growing capacity shortfalls in coming years, especially in light of the increased impacts of extreme weather. Winter weather, in particular, is emerging as a big challenge as past reliability assessments assumed that natural gas was always reliable. In severe winter storms, however, the gas system becomes stress and many gas generators suffer forced outages due to insufficient fuel availability. This was most stark in the February 2021 Texas outages, but there are a growing number of examples.
Managing reliability in continually changing power markets dominated by variable renewable energy and facing climate change-driven changes will be the defining power sector policy challenge in the next several decades. Markets and multiple resource types can provide the tools but will require diligent policy focus to ensure we are designing the right types of markets.
5. Retirements, Competitiveness, and State Policy for Existing Nuclear Power

Source: Congressional Research Service
With high reliability and large power plants, nuclear power is the backbone of the American electric grid. It provides 20% of all U.S. power generation and about as much electricity as wind, solar, and hydro combined. Almost all nuclear plants in the U.S. were originally built in the 1960s and 1970s. They are aging facilities and, while costs are generally low once built, are facing strong price competition from natural gas in restructured wholesale markets.
This map and report from the Congressional Research Service provides a great high-level overview of the existing nuclear fleet during the last ten years. Thirteen reactors producing about 10% of total nuclear generation have retired since 2013. While some of these were due to botched maintenance issues, economic competition is a prime cause, leading to increased national and state carbon emissions. However, CRS has identified about 20 plants where state policy intervention has prevented retirements, keeping ~4% of total U.S. power generation and 10% of carbon-free generation from retirement.
It’s always important to remember that all maps are snapshots in time. In this case, this map is out of date because the four reactors in Illinois scheduled for retirement have been saved by state policy intervention. Similarly, the Palisades reactor in Michigan has since retired. Currently only two reactors are scheduled for retirement, at Diablo Canyon in California, and climate concerns may save those plants yet as the state sees titanic shifts in the politics of nuclear energy. Ultimately, a $6 billion fund approved in the infrastructure bill could delay any further retirements of existing nuclear facilities.
For more on nuclear retirements, existing plant economics, and policy tools, see my recent blog post.
6. Carbon emissions reductions map

Source: WRI
Of course, from an energy systems perspective, the specific share of coal, renewable energy, or other resources does not matter. Rather, progress in reducing carbon emissions is increasingly the primary non-cost metric that we seek from our power supply.
A few comments on this map.
First, any maps charting changes will necessarily need relevant time frames. 2005 is a good base year as it used for most climate benchmarks and 2017 is a fine reference year because it was “normal” (as opposed to 2020 where data is wacky due to COVID disruptions).
Second, many states that are renewable and even low carbon leaders, like wind-heavy Texas and hydro-heavy Washington, do not jump out on this map. That reflects a few things. A lot of decarbonization has been driven by coal to gas substitution in the power sector, most visible in the East of the country which had the most and oldest coal plants (see map 2). Also, the power sector is only ~1/3 of total national emissions, so even with a clean-ish power sector, other emissions like transportation have not change much.
Third, absolute changes are important, but so are relative emissions. Other maps, like this one, examine per capita emissions and can show why some states (i.e. Wyoming, West Virginia) are so economically resistant to climate policy.
Overall, the U.S. is doing decent on emissions reductions, but they have been too heavily concentrated in the power sector and are not at the pace needed to support national and global climate goals. For some bonus emission maps, see Figure 3 here which shows absolute and relative emissions at a much more granular level.
7. LNG Exports Reshape American and Global Energy Flows

Source: LNG Allies
Just as the shale boom has fundamentally changed U.S. energy markets, it is poised to dramatically alter global natural gas markets through export of liquefied natural gas (LNG). By supercooling natural gas so it becomes a liquid, LNG export facilities make natural gas dense enough to transport on large ocean vessels. Historically, most natural gas markets were regional because of the limits of pipeline transport, but LNG trade is quickly creating globally integrated regional markets.
Given the low prices of shale natural gas production compared to world markets, the arrival of the shale revolution to the U.S. almost immediately led to interest in LNG exports. In the mid-2000s, the U.S. was originally posed to be a large importer of LNG. As natural gas production soared, many import facilities switched to export terminals.
As of mid-2022, the U.S. has an export capacity of 13 bcf/day of LNG, equivalent to ~16% of total demand, and is poised to become the world leader this year. It is using that capacity to the maximum, both to help Europe as it struggles to meet gas demand in the aftermath of Russia’s invasion of Ukraine and to supply Asia. As this map demonstrates, this export demand is concentrated on the Gulf Coast, the central historical hub of U.S. natural gas infrastructure. However, the geologic resources of shale are concentrated elsewhere, especially in the Appalachian Marcellus shale.
Export facilities require FERC authorization, and FERC has several maps that show existing, approved, and under review export terminals. Given the geographic concentration of export facilities, their baseload nature, the mismatch with domestic supply, and the continued growth in export capacity, the future of LNG exports will dramatically reshape domestic natural gas markets. In general, higher and more volatile gas prices are likely compared to the last ten years, a major paradigm shift that will scramble power sector decision making.
8. Western utilities and states consider electric market opportunities

Source: S&P Global
A key part of the transition of the American electric grid is the rise of restructured wholesale power markets. In these markets, Independent System Operators (ISOs) provide relatively free access to the transmission grid, running hourly auctions to dispatch electricity on a marginal cost basis. These markets are one of the reasons that natural gas has been so effective and quick at replacing coal – cheap natural gas deprives coal plants (and other plants like nuclear) of revenue and profits very quickly.
Wholesale markets are generally effective at ensuring the least cost price for an hour of generation and bringing operational efficiencies but are more controversial regarding their impacts on long-term grid planning, reliability (as most recently seen in the 2021 Texas grid disaster), and ability to incentivize transmission development.
More recently, emerging issues in wholesale market rules threaten to slow renewable energy growth. The largest U.S. grid operator PJM is falling behind in managing interconnection requests for renewables. ISO-NE is struggling through market rules that disfavor renewables.
This relatively focused map shows one of the emerging regulatory developments of the 2020s – the battle for determining which markets run the Western electric grid. Other than South, the West is the primary region in the U.S. that has yet to embrace ISOs, in part due to the long distances limiting transmission infrastructure. As Western utilities and states look increasingly to decarbonization and harnessing their substantial renewable energy resources, market integration and participation can bring substantial economic benefits.
Many utilities have joined California ISO’s Energy Imbalance Market, the first step towards full RTO participation, in order to more profitably integrate variable renewables. Utilities in other states such as Colorado, Wyoming, and Montana are considering whether to join a similar market run by the Southwest Power Pool. An underlying tension across these decisions is that many utilities and states are hesitant to fully join CAISO, in fear of that state’s already influential energy policy dominating all of Western electric markets.
9. Advanced reactor innovation map

Source: Third Way
This map is useful as it shows that nuclear innovation is:
Happening now with operational plans and plants under construction overseas
Highly geopolitical, with stiff competition between the U.S., China, and Russia with some middle powers involved, and
Still in a precarious position in the U.S.
The U.S. is uniquely suited to lead nuclear innovation due to our public-private innovation model to have many designs and “shots on goal.” Nevertheless, we remain behind early projects in China and Russia and need to move quickly to ensure we can remain competitive down the line. Key challenges include the slow pace of NRC’s regulatory modernization, insufficient venture capital availability, and (until recently) the lack of a clear domestic market. Higher natural gas prices and the general disruptiveness of current energy geopolitics is scrambling that last barrier and many utilities are increasingly considering advanced reactors for their decarbonization and energy needs.
That said, if I were to make this map I would not include a number of the American projects. These are not “projects” per se, with clear customers, signed contracts, or other signs of a high likelihood of success. Rather, they are companies with relatively mature designs that could achieve such contracts relatively soon.
There are at least six American commercial demonstration projects that would likely meet my criteria:
Terrapower in Wyoming
X-Energy in Washington
NuScale/UAMPS in Utah/Idaho
Oklo in Idaho
USNC in Illinois
Kairos in Tennessee
Of course, these are just terrestrial power reactors. The Department of Defense is pursuing several types of microreactors, there are multiple space reactor projects, and the Department of Energy has several research and testing reactors in the work.
When combined, the U.S. has a lot of potential compared to many nations. In the next decade the industry will need to prove it can execute projects on time and on budget, despite the slow pace of regulatory innovation and atrophied supply chains. For more, see the joint NIA-PGS strategy on how to develop American advanced nuclear energy leadership.
10. US energy trade with Canada and Mexico
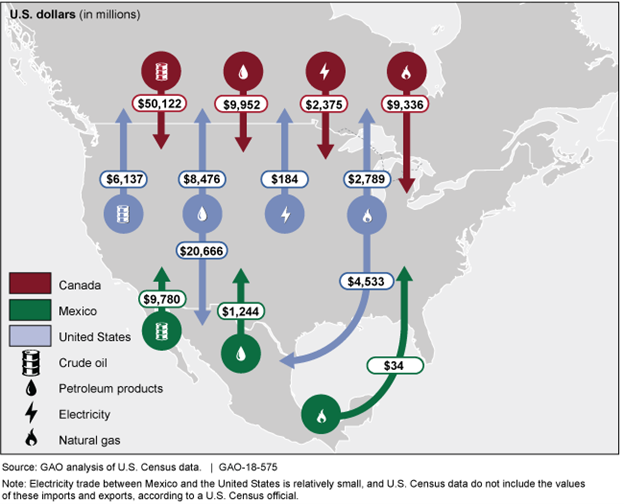
Source: Government Accountability Office
For all of the talk about international trade being “overseas,” our two closest energy trading partners are our land-tied neighbors Canada and Mexico. Both are large exporters of oil to the U.S. and importers of petroleum products. Calls for American “energy independence” largely miss the tight trading relationship and its inherent energy security benefits, even as calls for global “energy interdependence” can overstate the importance of other actors than Canada and Mexico.
I don’t have a lot more to add to this map, other than the point that even as the specific details of our North American may fluctuate with technology and market developments like shale, the general picture has been relatively robust for decades and is likely to remain so during the energy transition. Value of energy trade between the U.S. and Mexico is at a 9-year high, while U.S.-Canada energy trade is quickly recovering from the 2020 COVID downturn.
11. Global maritime shipping route choke points

Source: The Economist/EIA
One of the more interesting shifts of the last ten years, and one that has been relatively unappreciated by many commentators, is that rising U.S. domestic production has reduced American energy security vulnerabilities to maritime oil trade even as rising Chinese oil consumption has quickly increased Chinese vulnerability.
Whereas the Strait of Hormuz has been the maritime chokepoint for decades, the Strait of Malacca and the South China Sea are now as important to Chinese energy security. This map demonstrates this shift, as well as the continued importance of other maritime chokepoints. Although not a purely domestic issue, this major strategic shift is a direct result of the rise of U.S. shale.
For as much as American security commentary have denounced Chinese expansionism in the South China Sea as imperialistic, it also reflects a deep recognition by the Chinese of the vulnerability of their oil supply route. If oil passage through the Strait of Malacca or the South China Sea is hindered, the supply of 10+ million barrels of oil per day could be threatened, sending the Chinese economy (and the world’s) into an immediate crash.
The geopolitical ramifications of the shifting importance of oil chokepoints are still developing. Recent US reticence about its relationship with Saudi Arabia has in part been fueled by the country’s rapidly shrinking energy security interest in the Strait of Hormuz. Chinese ambitions for a blue ocean navy and overseas bases like Djibouti are driven, in part, by their growing interest in protecting the Strait of Hormuz-Indian Ocean-Strait of Malacca-South China Sea route.
12. Offshore wind potential

Source: NREL
Even as onshore wind hits resource and siting constraints, and solar supply chains remain embroiled in ethical issues, there is one sleeping renewable energy source that is poised for a massive boom in the next decade: offshore wind.
The characteristics of offshore wind make it especially well-suited to energy grids of the future. Individual turbines are massive, with the largest now pushing 15 megawatts-electric. Offshore winds are often not correlated with onshore winds, meaning that integrated systems require less balancing and load management. In many cases, as this map demonstrate, offshore wind resources are located right next to coastal load centers.
With these traits, it’s no wonder why offshore wind has taken off in Europe, which has developed more than 25 gigawatts in the last twenty years. The location of most of the wind in the North Sea has enabled easy interconnection to European electricity markets and facilitated continued strong growth.
The U.S. is now moving towards offshore wind of its own. The first prototype projects are now getting developed or even operating. The Biden Administration has set a goal to develop 30 gigawatts by 2030. The Bureau of Ocean and Energy Management has just released a draft environmental impact statement for a 1.1 gigawatt offshore wind farm near New Jersey.
There are certainly challenges to offshore wind development in the U.S., which are slowly getting addressed:
Regulatory processes and inertia.
Overlapping jurisdictions.
High costs.
Developing domestic supply chains.
More broadly, however, offshore wind also benefits from industry growth and U.S. policy support for other wind technologies. As described in DOE’s recent supply chain study on wind, many aspects of the domestic supply chain are robust and can expand into meeting the needs of offshore wind. For more on offshore wind economics, see this NREL report.
13. Supply of rare earths and other components

Source: Congressional Research Service
Another report from the Congressional Research Service examines one of the greatest challenges of the energy transition: it is a change from a fuels-based commodity energy system to a metals-based capital energy system.
Technically, the report and analysis are broader than just energy transition metals, but it does a great job at highlighting the scope of U.S. import dependence on foreign supply for all sorts of industrially relevant minerals. An energy-specific report from the International Energy Agency looks at the specific mineral requirements for many technologies:
Electric vehicles need graphite, cobalt, nickel, manganese, copper, lithium, and rare earths
Wind needs copper, zinc, nickel, manganese, chromium, molybdenum, and rare earths
Solar needs silicon and copper
Nuclear needs copper, nickel, manganese, and chromium
Per this map, the U.S. imports 100% of some of these minerals at least 50% for all of them. Several specific countries are the dominant suppliers for some of these, including China.
I like this map because of the combination of information communication methods it uses. There is a lot of information here, with the total import dependence described in the table on the right, with specific call outs for the most important minerals for each region. Sometimes comprehensive maps help but when there is too much base information (like map 3), a good mapmaker is selective in highlighting the most relevant information for their message.
One limitation for this map is that it is only focused on the end supply of a mineral to the U.S. In reality, mineral supply chains are longer and include many mines that are separate from the processing locations. For many minerals, like rare earth elements, China does not necessarily mine the raw ore but rather imports raw ore to processing facilities that then support export. Addressing mineral supply chains requires end-to-end strategies, including recycling.
14. Banning natural gas bans

Source: S&P Global
Even as the shale revolution has decarbonized the power sector, many state and local governments are concerned about how to reduce emissions from natural gas in other sectors. In particular, many cities are looking at banning new natural gas hookups as a means of reducing gas demand locally. Personally, I’m not sure about this policy as it discriminates against new households and businesses while often not addressing existing demand, but it is nonetheless a popular local policy.
However, unlike renewable standards or other popular policies, banning new natural gas hookups has received considerable state-level backlash across the country. Per this map, almost 40% of states have banned city action on restricting natural gas utilities, vastly outnumbering those that seek to support it. I like this map a lot because it reveals the highly partisan divide on the future role of natural gas. These restrictions are partisan in nature, with red-leaning states limiting the local sovereignty of blue-leaning municipalities.
Beyond the politics, underlying these policies is a growing body of hotly debated literature about the greenhouse gas benefits of electric heat pumps versus natural gas space heating. Some studies show broad benefits, some show site specific ones, and the gas lobby argues gas is often best.
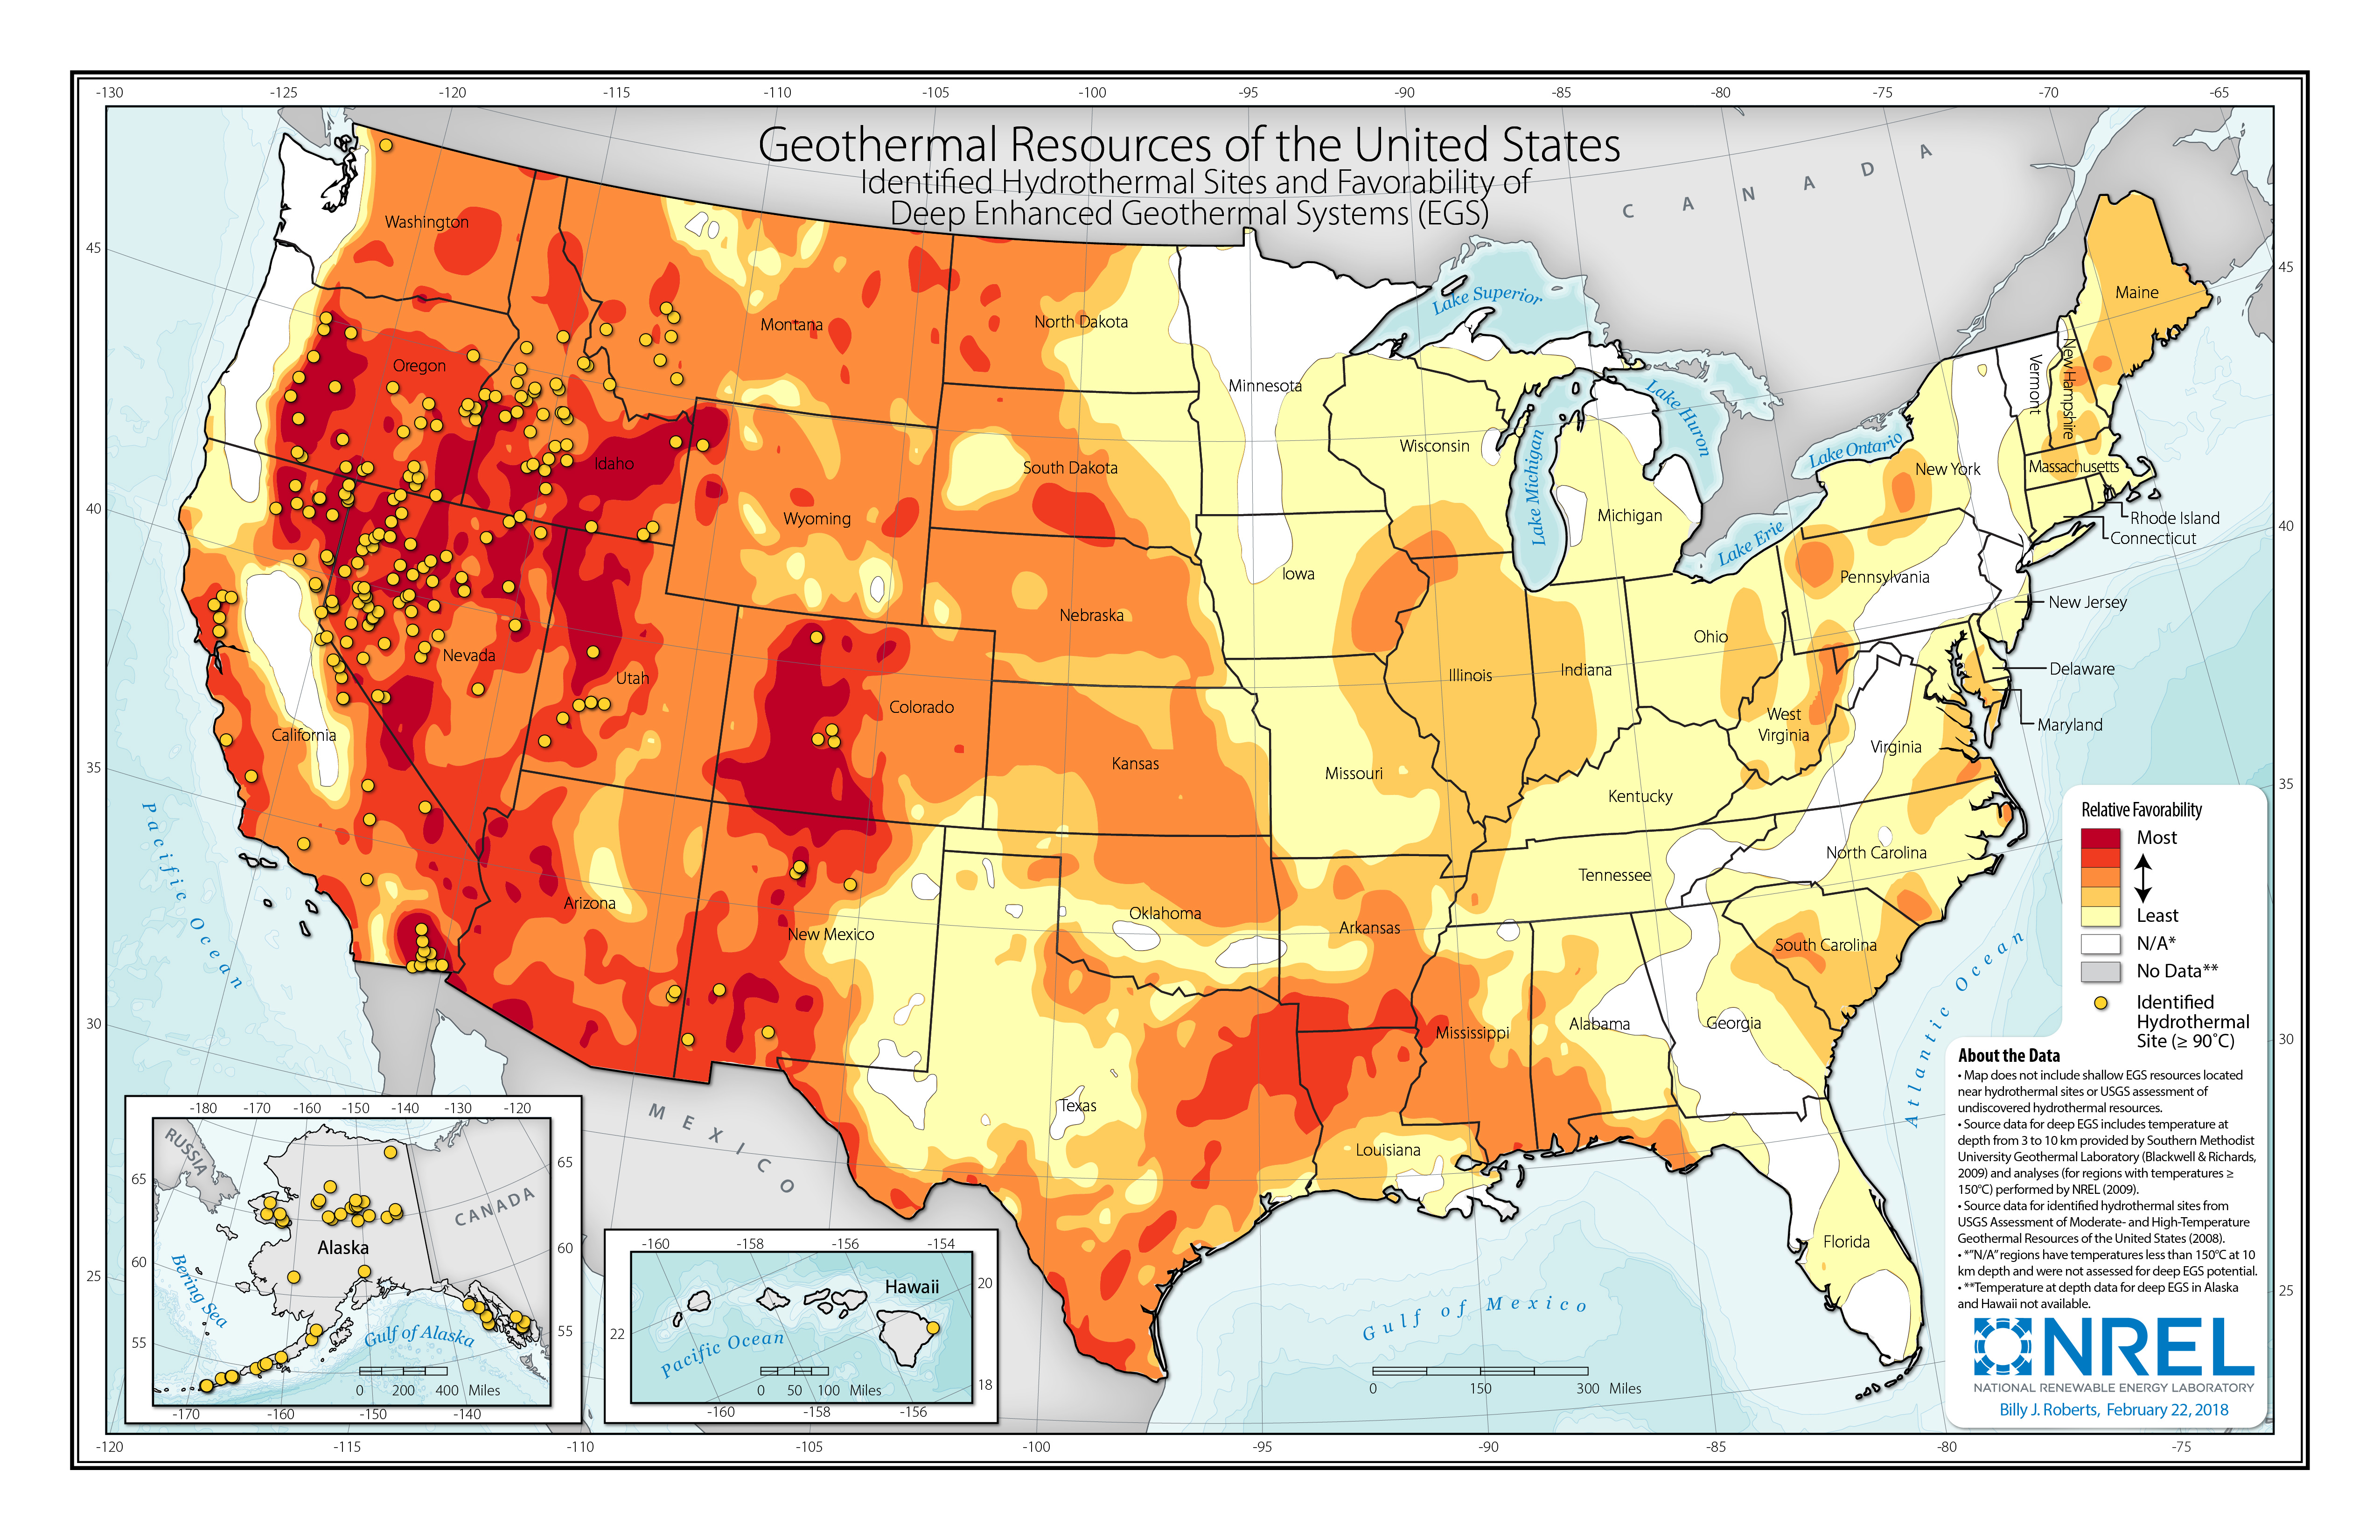
15. Enhanced geothermal could make ideal dispatchable renewable source

Source: NREL
No list of the best energy maps would be complete without at least two NREL renewable energy resource maps and this one is probably as important as the offshore wind map.
Just like offshore wind, enhanced geothermal systems (EGS) may be the next major power innovation set to take off in U.S. energy markets. By injecting water to deep sources of heat in the Earth’s crust and returning that water to the surface, EGS captures energy from the Earth’s core. The concept, which involves many of the same drilling skills and technology as oil and gas drilling, is rapidly advancing to maturity.
Given its baseload nature, EGS could strongly complement variable renewable energy and energy storage. It also can potentially serve non-power markets such as district heating, hydrogen production, and more.
Like other renewable resources, this map demonstrates that EGS has a heavy geographic concentration, especially in the Western U.S. Resources in Texas, Colorado, and Nevada could all be early targets due to relative proximity to load centers and, in the case of the first two, substantial experience with oil and gas drilling.
This Vox post and the DOE GeoVision report have much more detail on the potential of enhanced geothermal.
The Changing Geographies of the Energy Transition
As these maps demonstrate, there is a substantial geographic element to the American energy transition. Some fossil states are well suited to renewable energy production while others, like Wyoming and West Virginia, may need concerted innovation efforts to stay competitive. Market changes this last decade have not only reshaped national energy geographies and politics, they have also restructured global energy geopolitics. As energy markets and policymakers navigate the current inflection point in the energy transition and macroeconomic conditions, it is likely that this geographic shift will continue in the 2020s and 2030s.